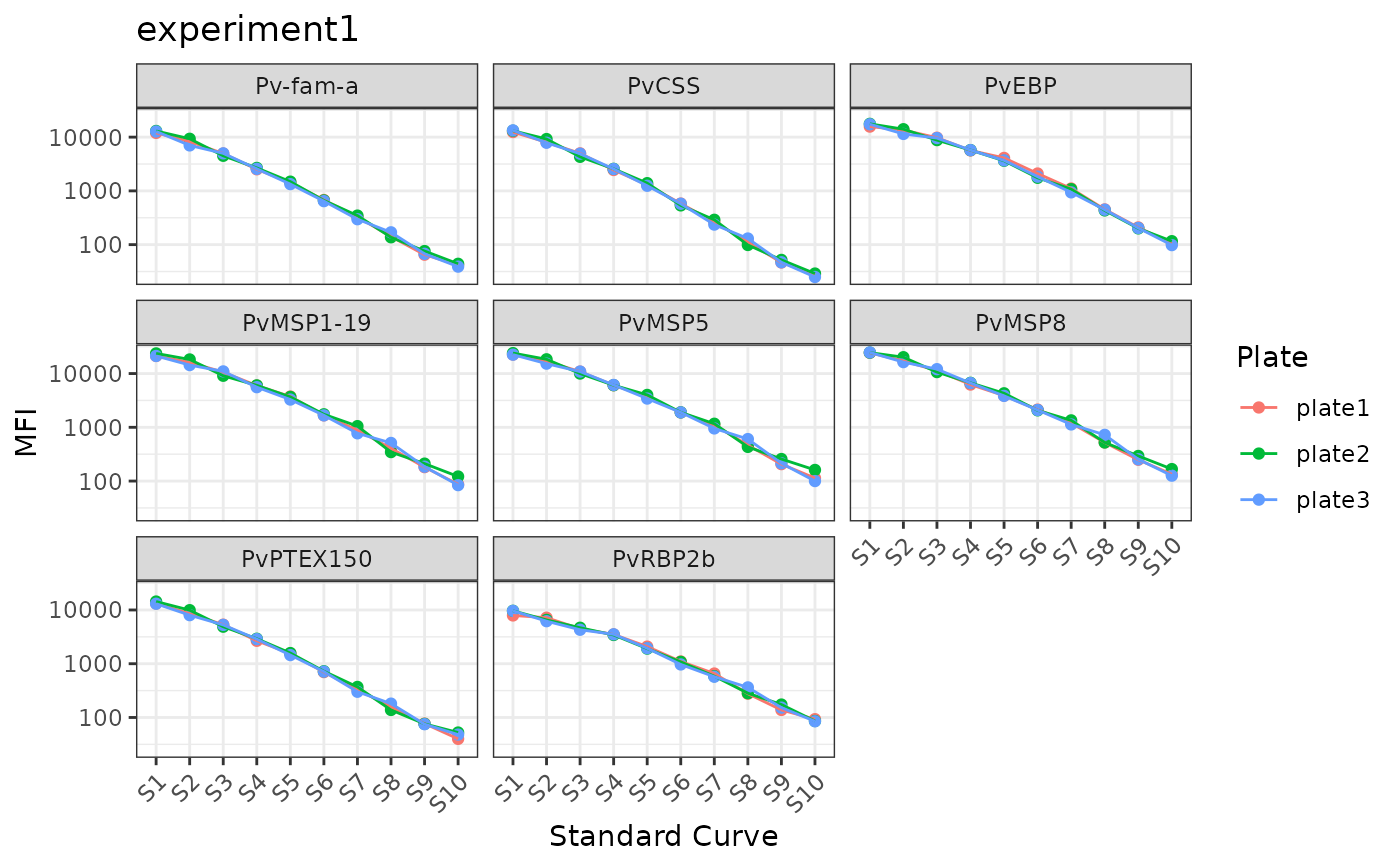
This function gets the standards data and plots the standard curves for any antigens (i.e., non-PvSeroTaT specific).
Value
- Dot and line plot of standard curves (S1-S10) - WEHI-acceptable standard curve data on background of plot with user data.
Examples
# \donttest{
# Example demonstrating how to process bead count data.
# These files are included in the SeroTrackR package under inst/extdata.

your_raw_data <- c(
   system.file("extdata", "example_MAGPIX_plate1.csv", package = "SeroTrackR"),
   system.file("extdata", "example_MAGPIX_plate2.csv", package = "SeroTrackR"),
   system.file("extdata", "example_MAGPIX_plate3.csv", package = "SeroTrackR")
)

# Read in raw MAGPIX data
sero_data <- readSeroData(
  raw_data = your_raw_data,
  platform = "magpix"
)
#> PASS: File example_magpix_plate1.csv successfully validated.
#> PASS: File example_magpix_plate2.csv successfully validated.
#> PASS: File example_magpix_plate3.csv successfully validated.

# Plot Standards
plotStds_all(
  sero_data = sero_data,
  experiment_name = "experiment1"
)


# }
# }