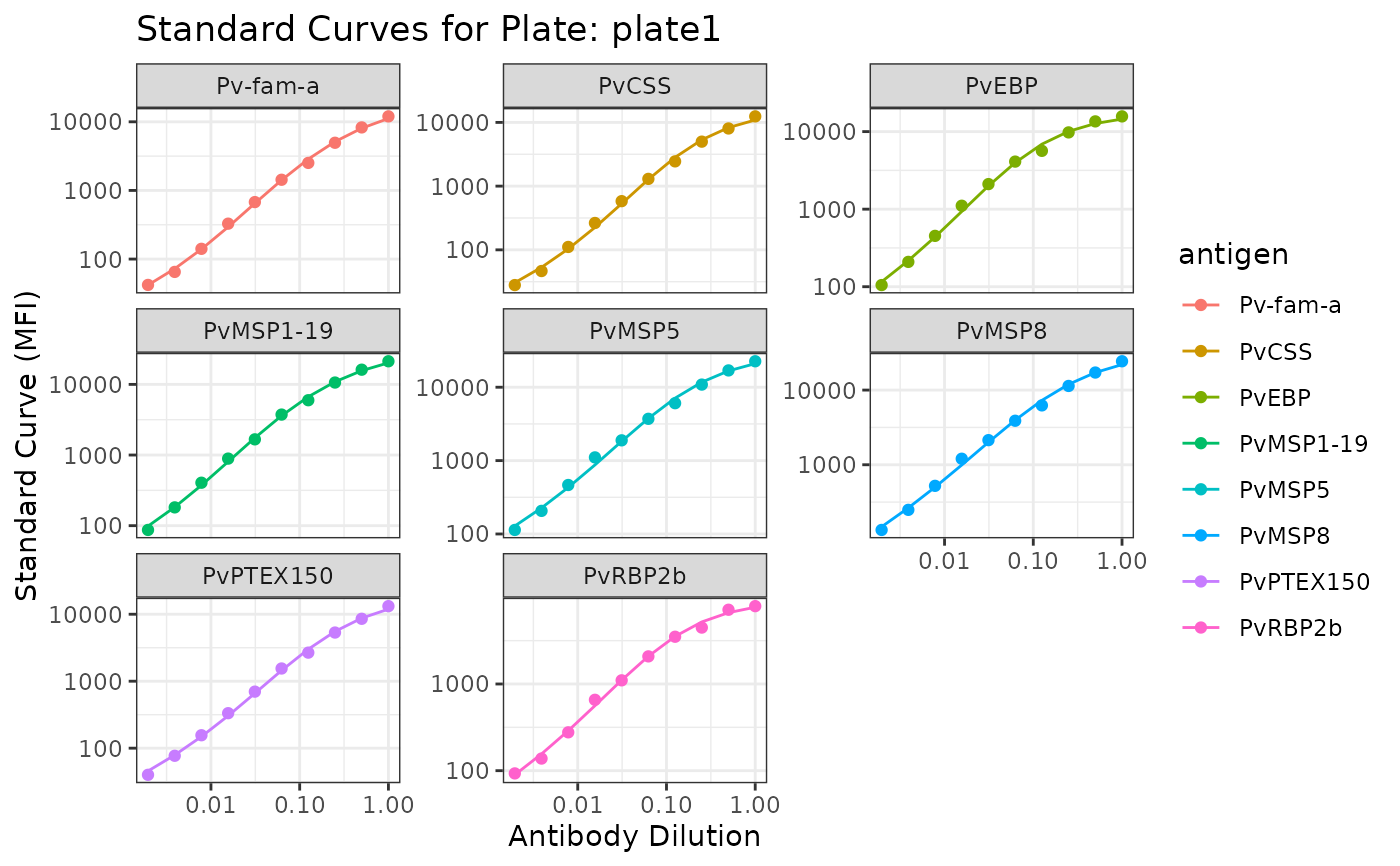
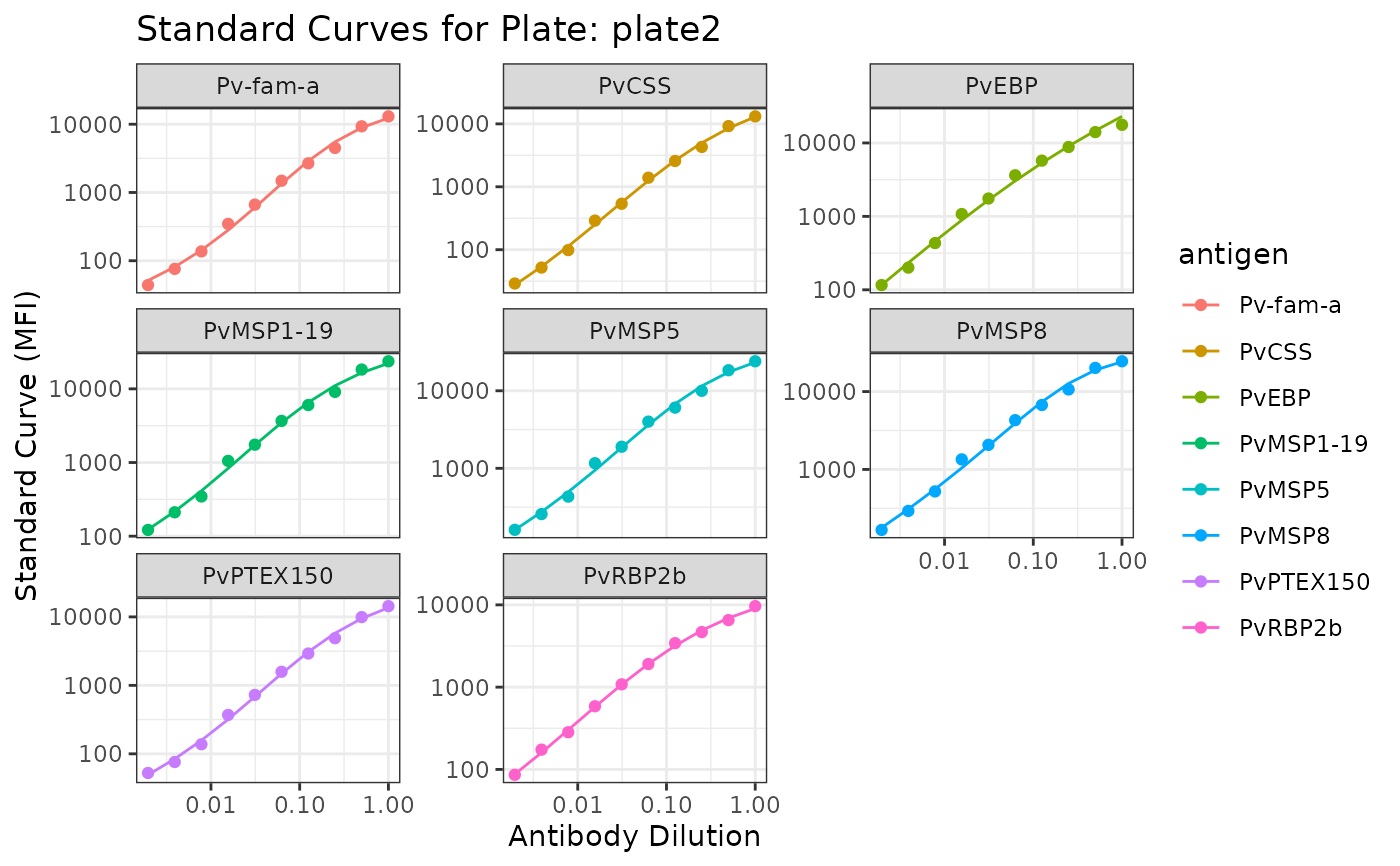
Plot the Median Fluorescent Intensity (MFI) to Relative Antibody Units (RAU) Results Data based on ETH standard
Source:R/plotModel.R
plotModel_Adj.RdThis function gets the Median Fluorescent Intensity (MFI) to Relative Antibody Units (RAU) model results data and plots the model fits based on `MFItoRAU_Adj.`
Value
List of dot and line plots of MFI to RAU model standard curve, with each one representing an individual plate (ggplot).
Examples
# \donttest{
# Step 0: Load example raw data
your_raw_data <- c(
system.file("extdata", "example_MAGPIX_plate1.csv", package = "SeroTrackR"),
system.file("extdata", "example_MAGPIX_plate2.csv", package = "SeroTrackR")
)
your_plate_layout <- system.file(
"extdata",
"example_platelayout_1.xlsx",
package = "SeroTrackR"
)
# Step 1: Read serology data and plate layout
sero_data <- readSeroData(your_raw_data,"magpix")
#> PASS: File example_magpix_plate1.csv successfully validated.
#> PASS: File example_magpix_plate2.csv successfully validated.
plate_list <- readPlateLayout(your_plate_layout, sero_data)
#> Plate layouts correctly identified!
# Step 2: Process counts and perform quality control
qc_results <- runQC(sero_data, plate_list)
# Step 3: Convert MFI to RAU using ETH beads
mfi_to_rau <- MFItoRAU_Adj(
sero_data = sero_data,
plate_list = plate_list,
qc_results = qc_results
)
#> Joining with `by = join_by(antigen)`
#> Joining with `by = join_by(antigen)`
#> Joining with `by = join_by(antigen)`
#> Joining with `by = join_by(antigen)`
#> Joining with `by = join_by(antigen)`
#> Joining with `by = join_by(antigen)`
# Step 4: Plot Model Results
plotModel_Adj(mfi_to_rau, sero_data)
#> $plate1
#> Ignoring unknown labels:
#> • fill : "Antigen"
 #>
#> $plate2
#> Ignoring unknown labels:
#> • fill : "Antigen"
#>
#> $plate2
#> Ignoring unknown labels:
#> • fill : "Antigen"
 #>
# }
#>
# }