This function gets the count data and plots the plate image, creating a new facet (i.e., panel) for each antigen and each line represents the different plates so that they can be visualised.
Value
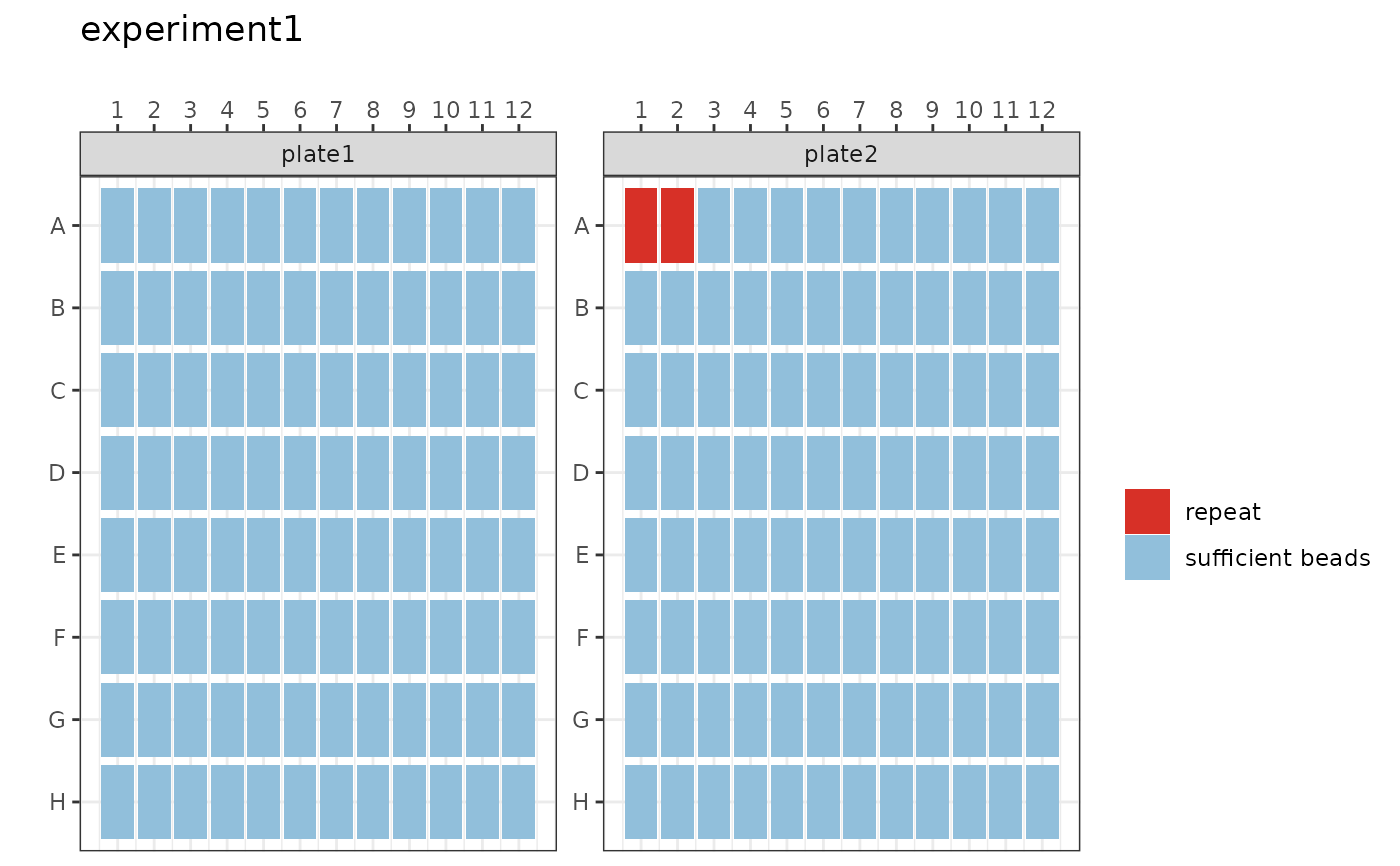
Tile Plot showing binary result of "sufficient beads" with cut-off >15 beads and "repeat" less than or equal to 15 beads (ggplot).
Examples
# \donttest{

# Step 0: Load example raw data
your_raw_data <- c(
  system.file("extdata", "example_MAGPIX_plate1.csv", package = "SeroTrackR"),
  system.file("extdata", "example_MAGPIX_plate2.csv", package = "SeroTrackR")
)
your_plate_layout <- system.file(
  "extdata",
  "example_platelayout_1.xlsx",
  package = "SeroTrackR"
)

# Step 1: Read serology data and plate layout
sero_data  <- readSeroData(your_raw_data,"magpix")
#> PASS: File example_magpix_plate1.csv successfully validated.
#> PASS: File example_magpix_plate2.csv successfully validated.
plate_list <- readPlateLayout(your_plate_layout, sero_data)
#> Plate layouts correctly identified!

# Step 2: Process counts and perform quality control
qc_results  <- runQC(sero_data, plate_list)

# Step 3: Plot Counts
plotCounts(qc_results, "experiment1")

# }
# }