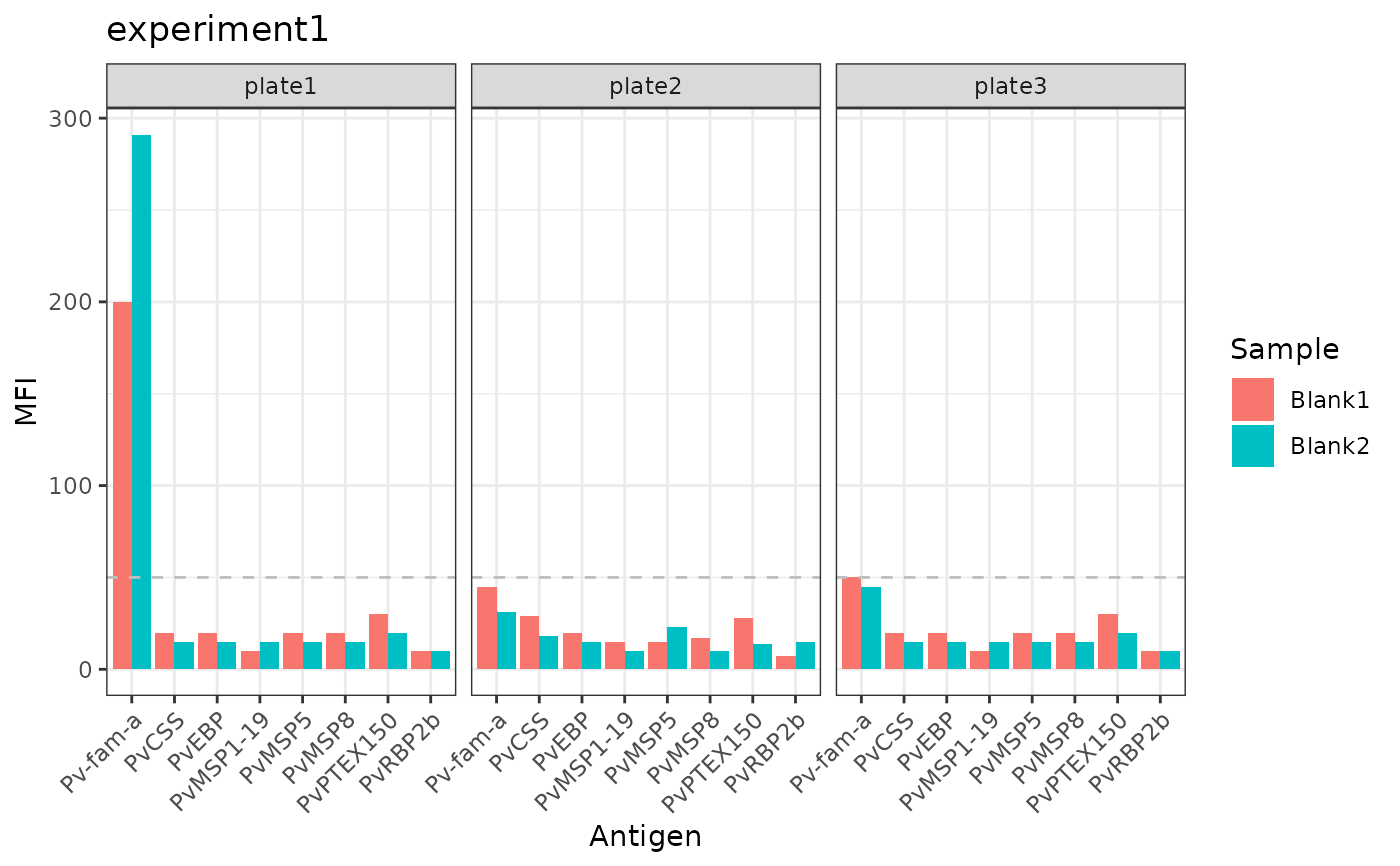
This function gets the blank sample data and plots the blank sample Median Fluorescent Intensity (MFI) values.
Value
Bar plot showing whether MFI values for the blanks for each antigen per plate is above or below the threshold MFI = 50 (ggplot).
Examples
# \donttest{
# Example demonstrating how to process bead count data.
# These files are included in the SeroTrackR package under inst/extdata.

your_raw_data <- c(
  system.file("extdata", "example_MAGPIX_plate1.csv", package = "SeroTrackR"),
  system.file("extdata", "example_MAGPIX_plate2.csv", package = "SeroTrackR"),
  system.file("extdata", "example_MAGPIX_plate3.csv", package = "SeroTrackR")
)

# Read in raw MAGPIX data
sero_data <- readSeroData(
  raw_data = your_raw_data,
  platform = "magpix"
)
#> PASS: File example_magpix_plate1.csv successfully validated.
#> PASS: File example_magpix_plate2.csv successfully validated.
#> PASS: File example_magpix_plate3.csv successfully validated.

# Plot blanks
plotBlanks(
  sero_data = sero_data,
  experiment_name = "experiment1"
)


# }
# }