The App
Inputting Data
This video walks you through the data entry component of the application.
- First, you add the (i) name of the experiment and (ii) date when the experiment took place which will be retained to name the subsequent figures and files generated in the app.
- You can add any experiment notes that might be necessary for the quality control check, which will be displayed in the PDF output of the QC report.
- Next, the user selects which Luminex platform was used to generate the data, as these machines export in different formats.
- Lastly, the user will upload their chosen raw Luminex data files (multiple .csv or .xlsx files accepted) and the 96 well plate layout (one master .xlsx file with multiple tabs accepted).
The output of the data input section involves the “Check Raw Data” tab which will print the data files without any data manipulation, the “Check Run Info” which is the generated from the Luminex machine that is printed at the top of the raw Luminex exported data, and lastly the “Check Plate Layout” tab which will print the tabs of the 96 well plates. These steps are more of a “sanity” check to ensure that the inputted files were correct and also were compatible with the application moving forward.
The tabs below contain sample information about what you can view in each section on the app.
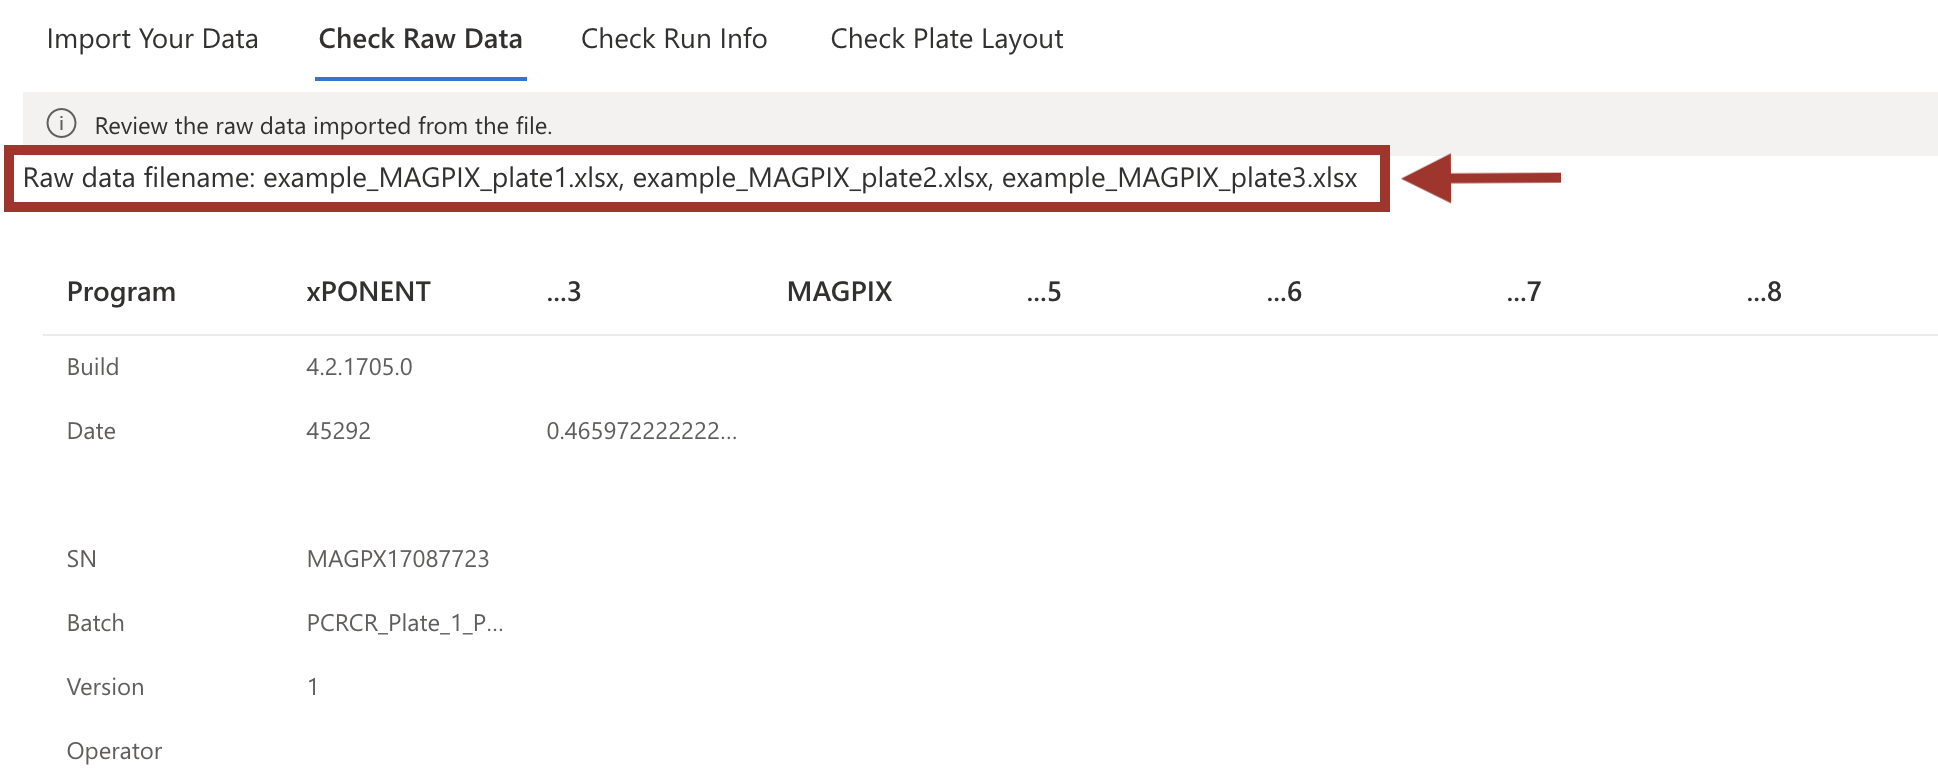
Here, you can cross-check that the raw data file/s that you uploaded were correct by looking at the “Raw data filename/s” (highlighted here in a red box and arrow).
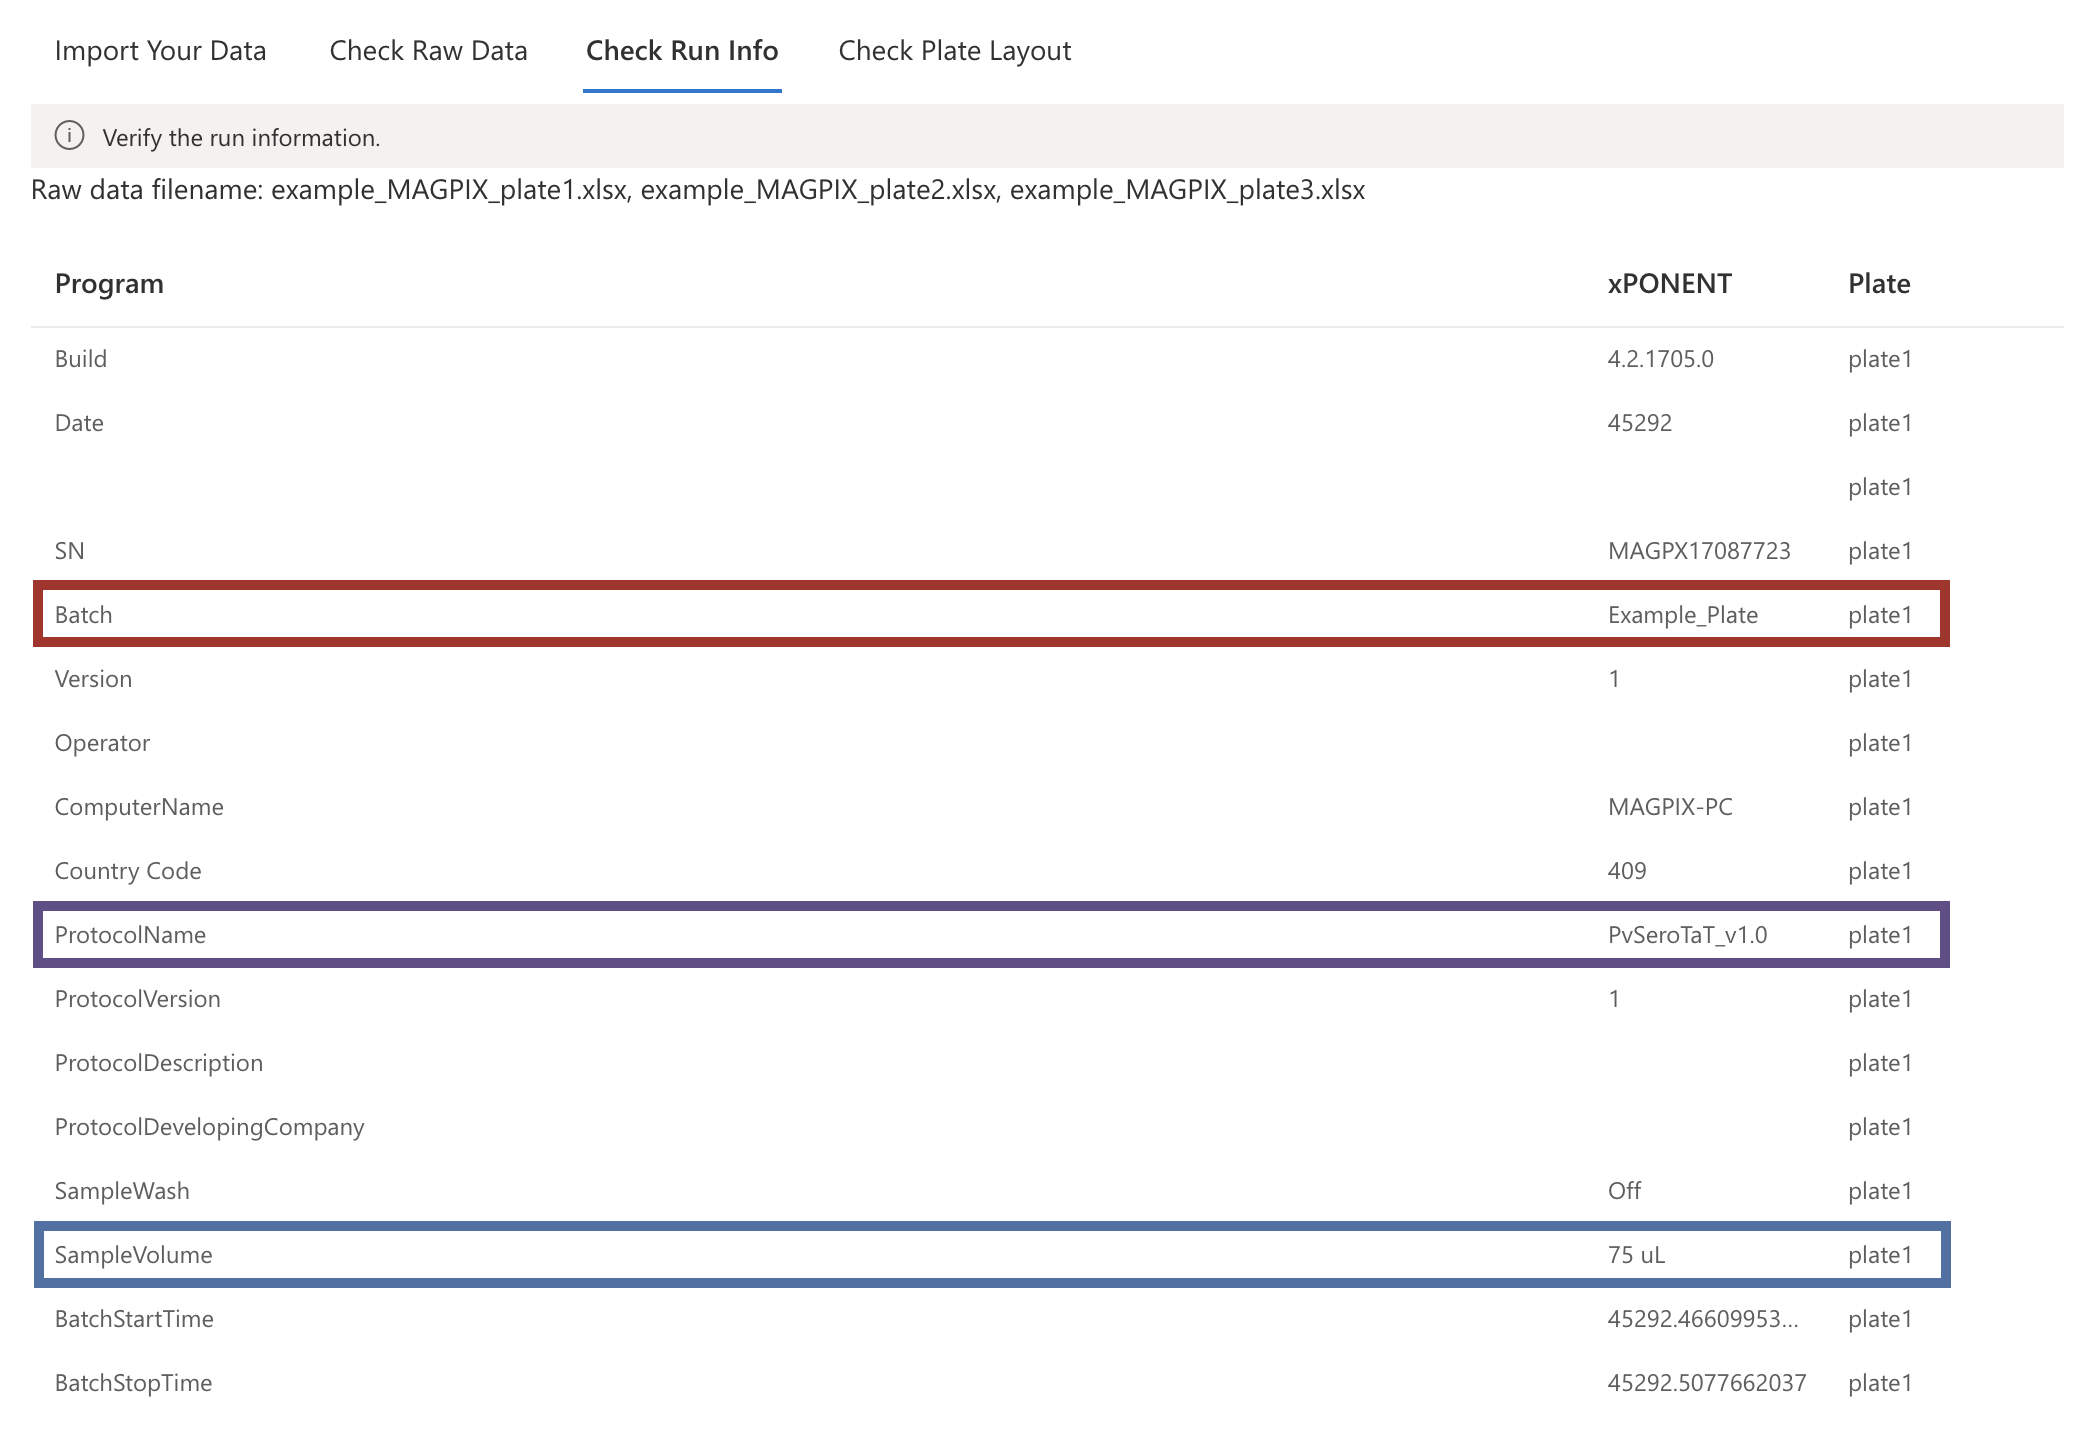
The “Check Run Info” tab can also be used to only look at run specifications and check that they are expected. You can check that the Batch, ProtocolName and Sample Volume are correct and labeled as you expect them to be. In the case of the example data, the Batch should be labeled “Example Plate”, the Protocol should be labeled “PvSeroTaT_v1.0”, and the Sample Volume should be “50uL” as we can see in the right hand side image here.
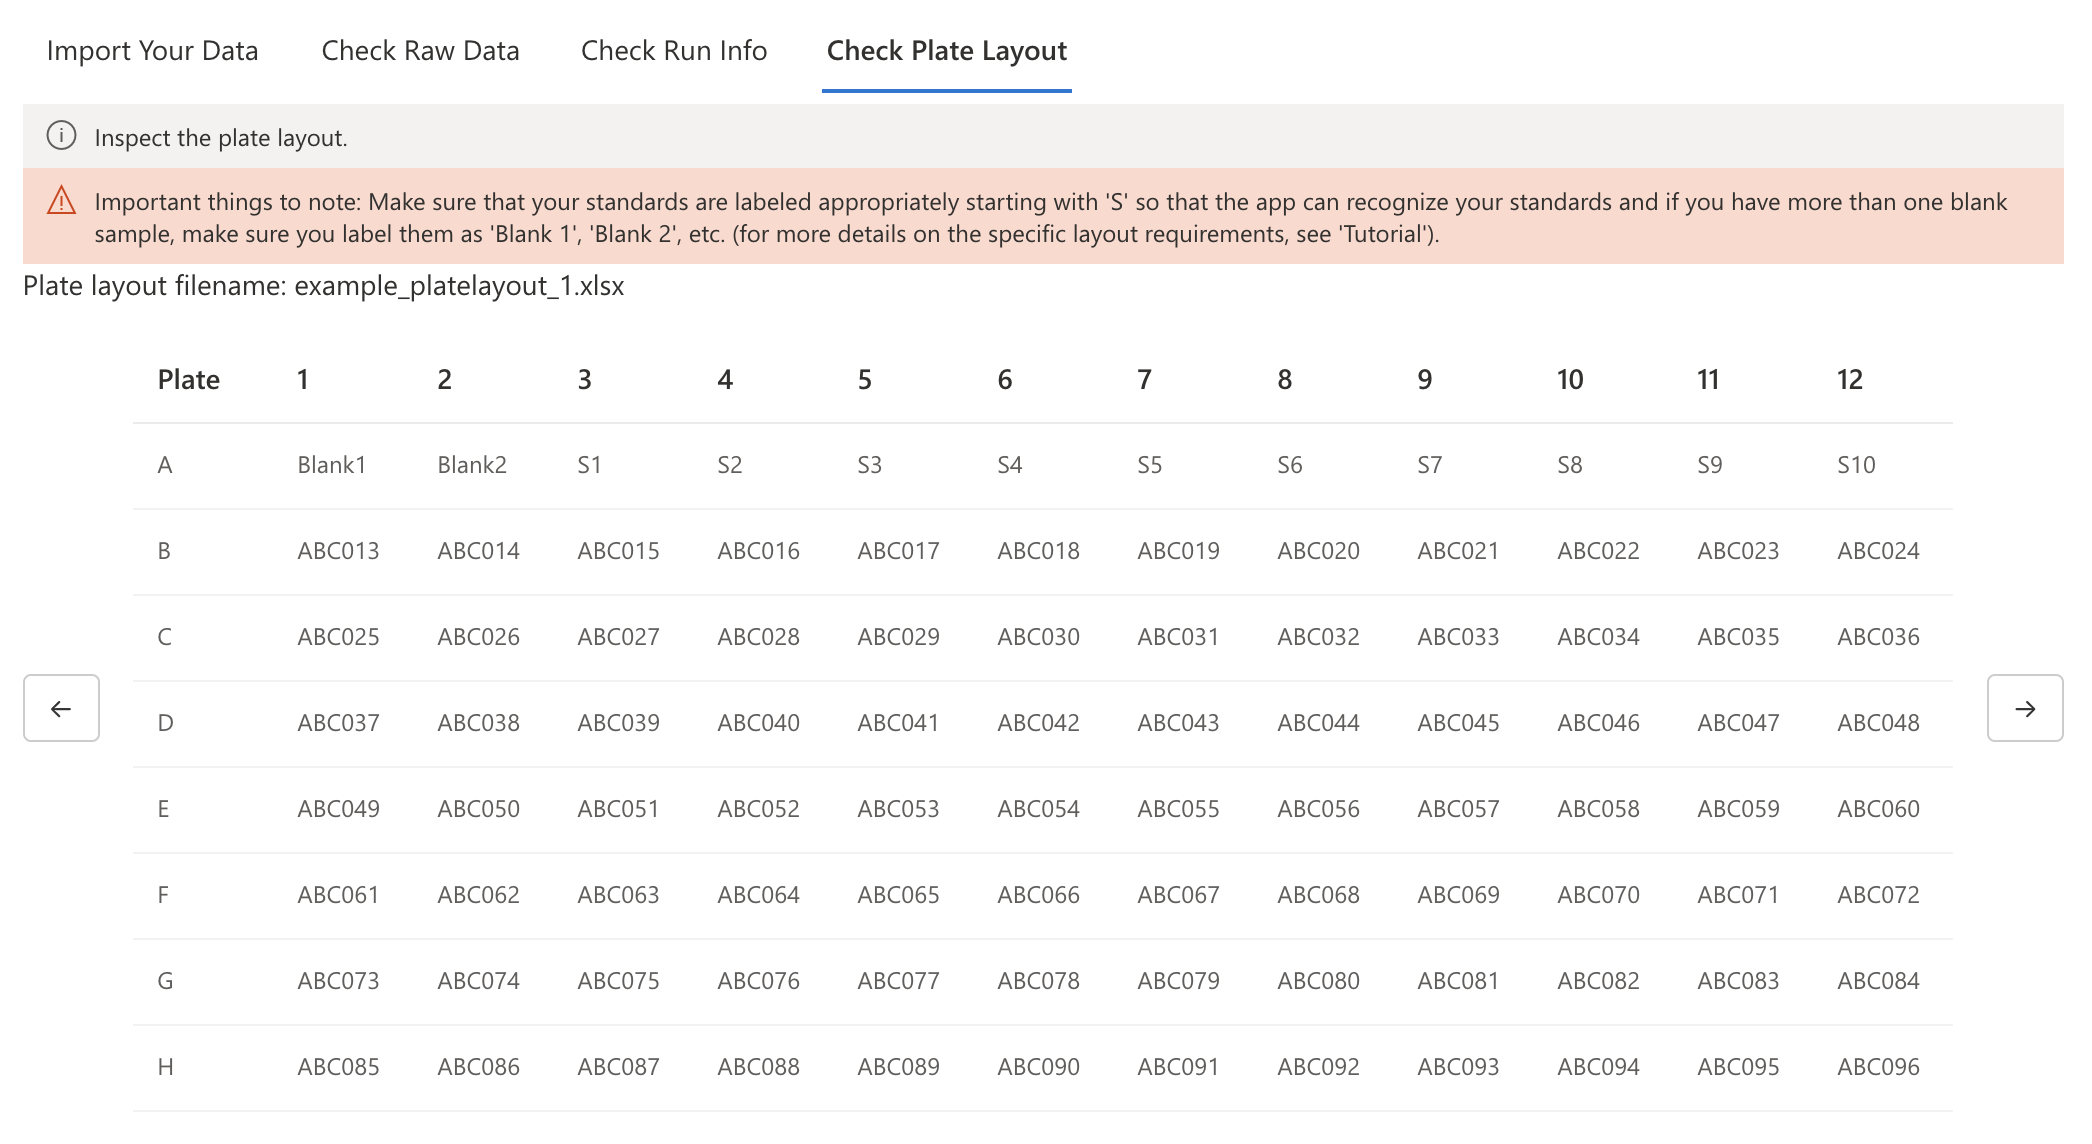
You can click on the “Check Plate Layout” tab to make sure the plate layout looks as expected. It is very important to make sure your samples are labeled correctly so that they are interpreted correctly by the app. You can also cross-check that the plate layout file you uploaded was the correct one, by looking at the “Plate Layout Filename” directly under the tab.
Quality Control
This section allows you to check the quality of the Luminex run, you can navigate each tab individually and also click the “Download” tab to download your processed sample data, the standard curve values and the quality control report. All of the plots in the “Quality Control” section are included in the QC report (.pdf) when downloaded.
Classification
The built-in classification algorithm in this application should only be applied to data generated from the PvSeroTaT Multi-Antigen Luminex Assay. The results from the classification are displayed in an interactive table that can be explored directly within the app and/or the data can also be downloaded in .csv format in the adjacent Download Data tab. The exposure status (positive/negative) is displayed for each sample and for all classifiers. Navigate to different pages using the numbers to view the data for all samples.
Data Visualisation
This web application has in-built data visualisation capabilities that allow you to explore your data as shown in the video below.